Fig. 3
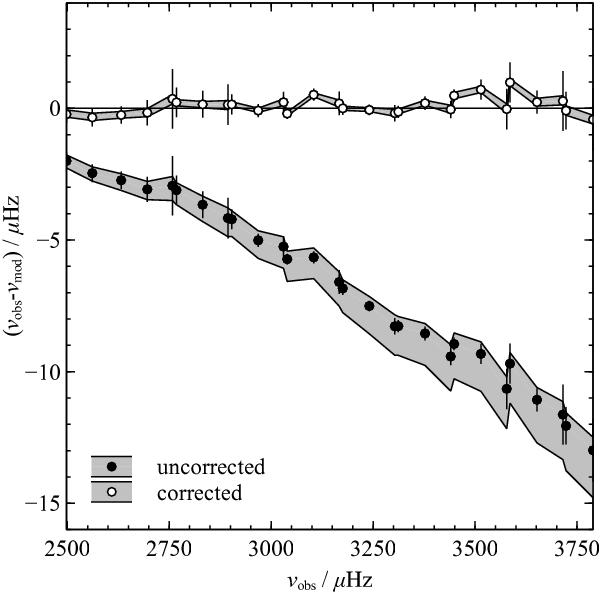
Uncorrected and corrected frequency differences between observed frequencies for the degraded solar data and MESA models fit using only the cubic term (Eq. (3)). The solid and empty points show the uncorrected and corrected differences with error bars that correspond to the observed uncertainties. The shaded regions show the spread of the modelled frequencies. i.e. taken from the 100 fits to random realizations of the observations. There is no obvious remaining trend in the corrected frequencies.
Current usage metrics show cumulative count of Article Views (full-text article views including HTML views, PDF and ePub downloads, according to the available data) and Abstracts Views on Vision4Press platform.
Data correspond to usage on the plateform after 2015. The current usage metrics is available 48-96 hours after online publication and is updated daily on week days.
Initial download of the metrics may take a while.