Fig. 2
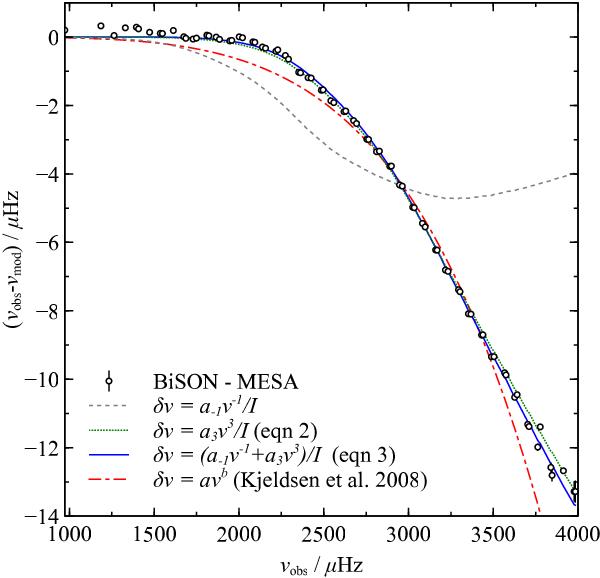
Frequency differences between a solar model calibrated with MESA and observations of low-degree modes (ℓ ≤ 3) by BiSON. The lines show fits made using an inverse term (dashed), cubic term (dotted) or both terms (solid). The relative performances of the fits is the same as Fig. 1. The dot-dashed lines show a power law, fit to nine radial orders about νmax = 3090μHz, as is used in the frequency correction proposed by Kjeldsen et al. (2008).
Current usage metrics show cumulative count of Article Views (full-text article views including HTML views, PDF and ePub downloads, according to the available data) and Abstracts Views on Vision4Press platform.
Data correspond to usage on the plateform after 2015. The current usage metrics is available 48-96 hours after online publication and is updated daily on week days.
Initial download of the metrics may take a while.