Fig. 4
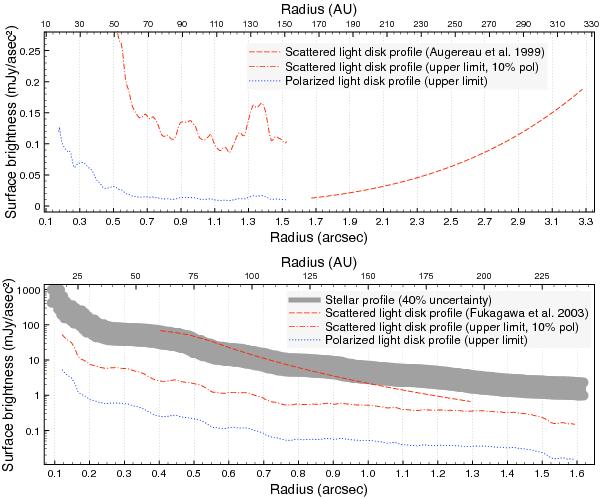
Surface brightness profile of HD 141569A in the H band along the southern major axis (top panel) and of HD 150193A in the H band along the northern major axis (bottom panel). The 3σ upper limit on the polarized-light profile is obtained from the QT and UT images. The 3σ upper limit on the scattered-light profile is obtained by assuming a conservative value for the polarization fraction of 10%. The gray area in the bottom panel denotes our measured stellar intensity profile, taking into account the 40% uncertainty from the photometric calibration. The scattered-light disk profile by Fukagawa et al. (2003) is still consistent with being an unsubtracted stellar PSF.
Current usage metrics show cumulative count of Article Views (full-text article views including HTML views, PDF and ePub downloads, according to the available data) and Abstracts Views on Vision4Press platform.
Data correspond to usage on the plateform after 2015. The current usage metrics is available 48-96 hours after online publication and is updated daily on week days.
Initial download of the metrics may take a while.