Fig. 3
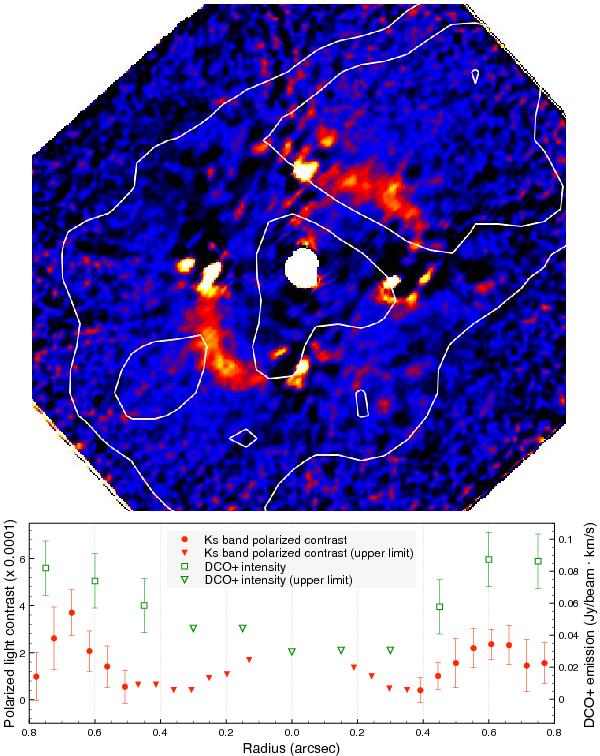
Top: DCO+ map from the disk of HD 163296 (Mathews et al. 2013) superimposed on our PDI KS-band image. The white contours indicate the emission at 3σ and 4σ level (σ = 18 mJy beam-1 km s-1). The DCO+ emission is depleted inside ~0.5″, while it reaches its maximum roughly at the location of the dusty ring. Bottom: DCO+ intensity along the major axis vs. contrast of the PDI images calculated from Eq. (4).
Current usage metrics show cumulative count of Article Views (full-text article views including HTML views, PDF and ePub downloads, according to the available data) and Abstracts Views on Vision4Press platform.
Data correspond to usage on the plateform after 2015. The current usage metrics is available 48-96 hours after online publication and is updated daily on week days.
Initial download of the metrics may take a while.