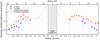
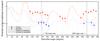
Fig. 2

Polarized emission distribution from HD 163296 in H and KS bands. Top: radial profile obtained from a 3 pixel-wide cut along the major axis (left side is East). Bottom: azimuthal profile obtained by integrating over concentric ellipses from 0.6″ to 0.7″ (see text for details). Only detections with more than 3σ are shown. The errors and the sensitivity are calculated from the local noise in both the QT and UT images. The sensitivity bumps are due to the AO spots. Systematic errors from the photometric calibration are not included. The vertical grey stripes in the azimuthal profile indicate the location of the major axis.
Current usage metrics show cumulative count of Article Views (full-text article views including HTML views, PDF and ePub downloads, according to the available data) and Abstracts Views on Vision4Press platform.
Data correspond to usage on the plateform after 2015. The current usage metrics is available 48-96 hours after online publication and is updated daily on week days.
Initial download of the metrics may take a while.