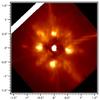
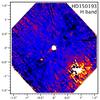
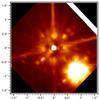
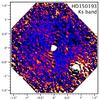
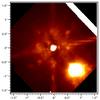
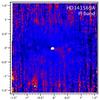
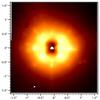
Fig. 1
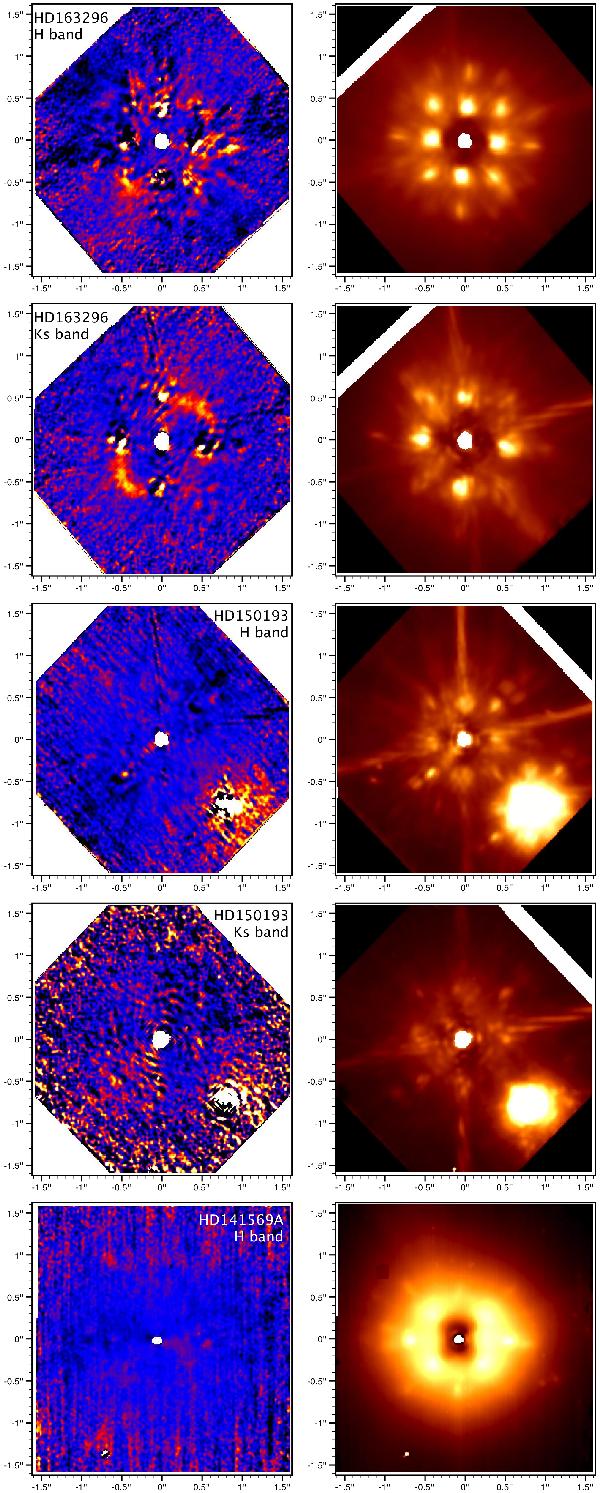
Polarized-light QT images (left column) and intensity I images (right column) of HD 163296, HD 150193, and HD 141569A. North is up, east is to the left. The central white area denotes the saturated pixels, which are not included in the analysis. All images are scaled by r2 to compensate for stellar dilution. This enhances the brightness of the companion and of all outer speckles. All QT images are shown with the same linear scale, whereas the scale of the I images is arbitrary to highlight each PSF.
Current usage metrics show cumulative count of Article Views (full-text article views including HTML views, PDF and ePub downloads, according to the available data) and Abstracts Views on Vision4Press platform.
Data correspond to usage on the plateform after 2015. The current usage metrics is available 48-96 hours after online publication and is updated daily on week days.
Initial download of the metrics may take a while.