Fig. 3
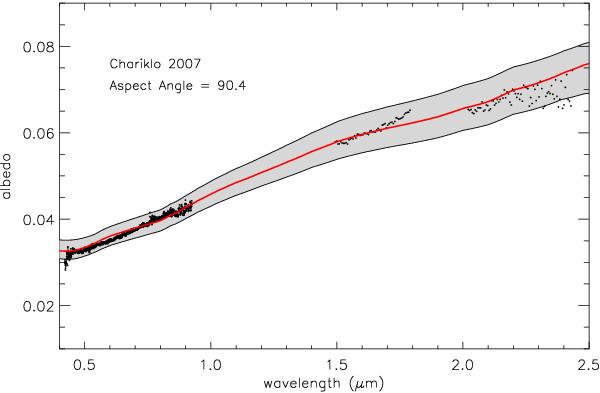
Spectral model of the system Chariklo and rings with the rings edge-on. The red line represents the best-fit to the spectrum (see Table 4 for details). The shaded area represents a set of the 30 best fits to the spectrum. The relative reflectance is normalized to the albedo value of each model at 0.55 μm for the fit; this albedo value is allowed to vary between 0.035 and 0.041 (see text for details).
Current usage metrics show cumulative count of Article Views (full-text article views including HTML views, PDF and ePub downloads, according to the available data) and Abstracts Views on Vision4Press platform.
Data correspond to usage on the plateform after 2015. The current usage metrics is available 48-96 hours after online publication and is updated daily on week days.
Initial download of the metrics may take a while.