Fig. 1
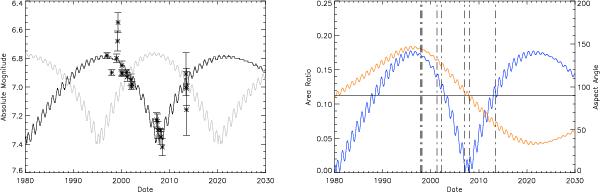
Left panel: variation of the HV during time. Data taken from Belskaya et al. (2010) and our own observations. The solid curve represents the model described by Eq. (1). It is fitted to the data, assuming the ring pole position mentioned in the text (λ = 138, β = 28). We assume that Chariklo’s rotation axis is aligned with ring pole. The grey line is the model assuming the other, wrong, pole position. The right panel shows the variation of the aspect angle with time (orange line, scale at right). As can be seen, the aspect angle is 90° in the period 2007−2008. The variation of the area ratio (blue line, scale at left) is also presented in this panel. Vertical lines are the dates when reflectance spectra were taken. The area of Chariklo was considered to be the one of an ellipsoid with axis a = 122 km, b = 122 km, and c = 117 km. The area of the rings were calculated with the parameters taken from Braga-Ribas et al. (2014).
Current usage metrics show cumulative count of Article Views (full-text article views including HTML views, PDF and ePub downloads, according to the available data) and Abstracts Views on Vision4Press platform.
Data correspond to usage on the plateform after 2015. The current usage metrics is available 48-96 hours after online publication and is updated daily on week days.
Initial download of the metrics may take a while.