Fig. 6
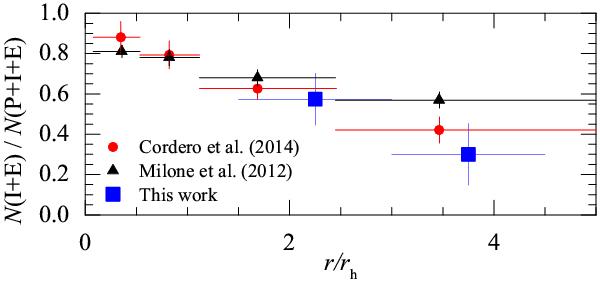
Ratios of stars in subsequent stellar populations in 47 Tuc, N(I + E) /N(P + I + E), plotted versus distance from the cluster center. Data from the spectroscopic study of Cordero et al. (2014) are shown as red circles, photometric results of Milone et al. (2012) are plotted as black triangles, while our data are shown as large blue rectangles.
Current usage metrics show cumulative count of Article Views (full-text article views including HTML views, PDF and ePub downloads, according to the available data) and Abstracts Views on Vision4Press platform.
Data correspond to usage on the plateform after 2015. The current usage metrics is available 48-96 hours after online publication and is updated daily on week days.
Initial download of the metrics may take a while.