Fig. 6
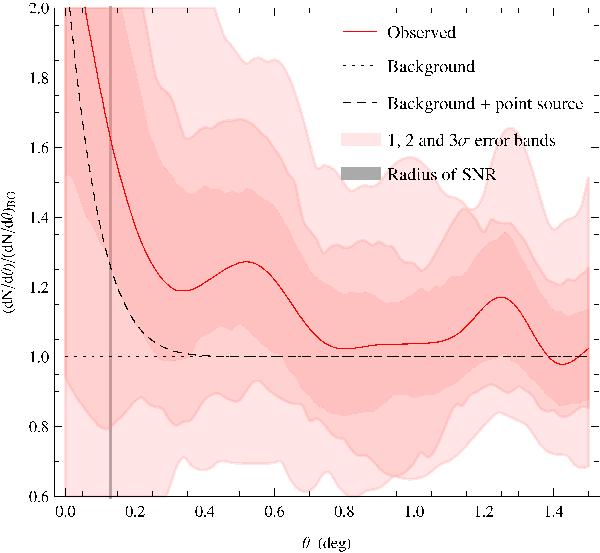
Radial distribution of γ-ray events (E> 10 GeV) around the centre of the SNR. The red line denotes the ratio between the signal and the background estimated events (dotted line). Dashed line assumes a point source located at the centre of the SNR. A slightly spatially extended (confidence level ~1.5σ) feature is related with SNR. In addition, the two excesses can be seen at 0.5° and 1.2° from SNR probably related to the two Fermi-LAT point sources at those distances (Nolan et al. 2012).
Current usage metrics show cumulative count of Article Views (full-text article views including HTML views, PDF and ePub downloads, according to the available data) and Abstracts Views on Vision4Press platform.
Data correspond to usage on the plateform after 2015. The current usage metrics is available 48-96 hours after online publication and is updated daily on week days.
Initial download of the metrics may take a while.