Free Access
Fig. 13
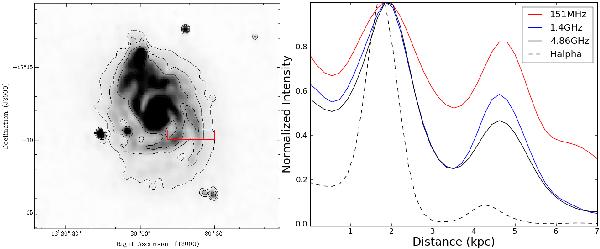
Intensity profile showing the arm and interarm contrasts of Hα and three different radio frequencies along a slice through M 51. The location of this slice is shown in the image to the right. The peak flux densities from each image are normalised to 1.
Current usage metrics show cumulative count of Article Views (full-text article views including HTML views, PDF and ePub downloads, according to the available data) and Abstracts Views on Vision4Press platform.
Data correspond to usage on the plateform after 2015. The current usage metrics is available 48-96 hours after online publication and is updated daily on week days.
Initial download of the metrics may take a while.