Fig. 2
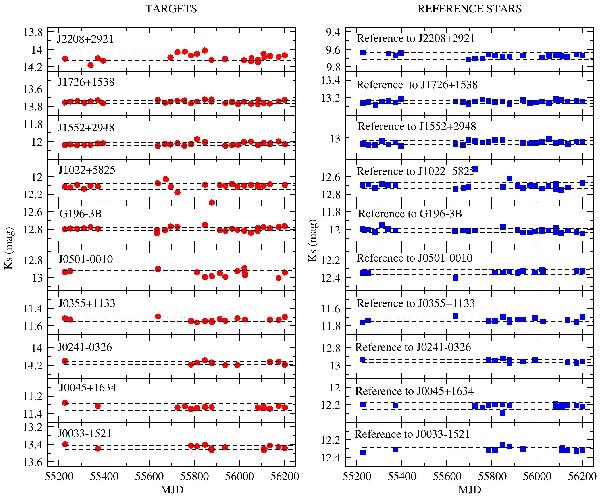
Photometric light curves for our ten targets (left panels), and for one of the reference stars used to compute the differential photometry for each target (right panels). The differential photometry (red circles and blue squares, respectively) has been shifted so that the average value corresponds to the mean Ks-magnitude of the objects. The horizontal dashed lines show the ± 1σ variation with respect to the average values for two comparison stars in the field of view of each target and reference star.
Current usage metrics show cumulative count of Article Views (full-text article views including HTML views, PDF and ePub downloads, according to the available data) and Abstracts Views on Vision4Press platform.
Data correspond to usage on the plateform after 2015. The current usage metrics is available 48-96 hours after online publication and is updated daily on week days.
Initial download of the metrics may take a while.