Fig. 1
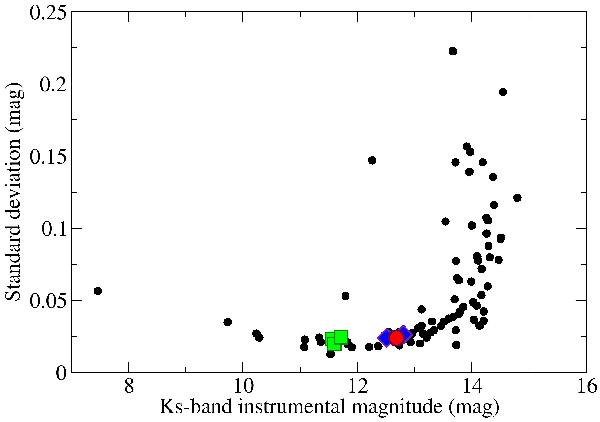
Example of the kind of diagram used to select the reference and comparison stars. The plot shows the standard deviation of the differential magnitudes of the stars in the J0241-0326 field, computed with respect to a large sample of these stars, versus the instrumental magnitude (see text for details). Variable stars stand out in this diagram because of their large standard deviations compared to other stars of similar brightness. Our target is indicated with a red circle, and the finally selected reference and comparison stars are plotted with green squares and blue diamonds, respectively.
Current usage metrics show cumulative count of Article Views (full-text article views including HTML views, PDF and ePub downloads, according to the available data) and Abstracts Views on Vision4Press platform.
Data correspond to usage on the plateform after 2015. The current usage metrics is available 48-96 hours after online publication and is updated daily on week days.
Initial download of the metrics may take a while.