Fig. 1
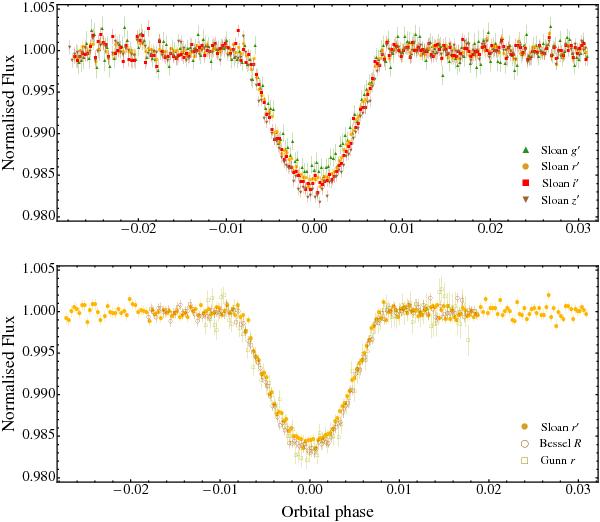
Light curves of WASP-67 b eclipses. Top panel: light curves obtained with GROND in g′r′i′z′, showing how the transit light curve shape changes with wavelength. The transit in the g′ band is shallower than the other bands, as expected for a grazing eclipse, as limb darkening is stronger at bluer wavelengths. Bottom panel: light curves obtained with DFOSC in the R-band (June 2013, brown open circles), with GROND in the r′-band (June 2012, yellow points) and with the Euler 1.2 m telescope in the r-band (July 2011, green open squares, Hellier et al. 2012). The light curves are superimposed to highlight variations in transit shape between the three measurements.
Current usage metrics show cumulative count of Article Views (full-text article views including HTML views, PDF and ePub downloads, according to the available data) and Abstracts Views on Vision4Press platform.
Data correspond to usage on the plateform after 2015. The current usage metrics is available 48-96 hours after online publication and is updated daily on week days.
Initial download of the metrics may take a while.