Free Access
Fig. 3
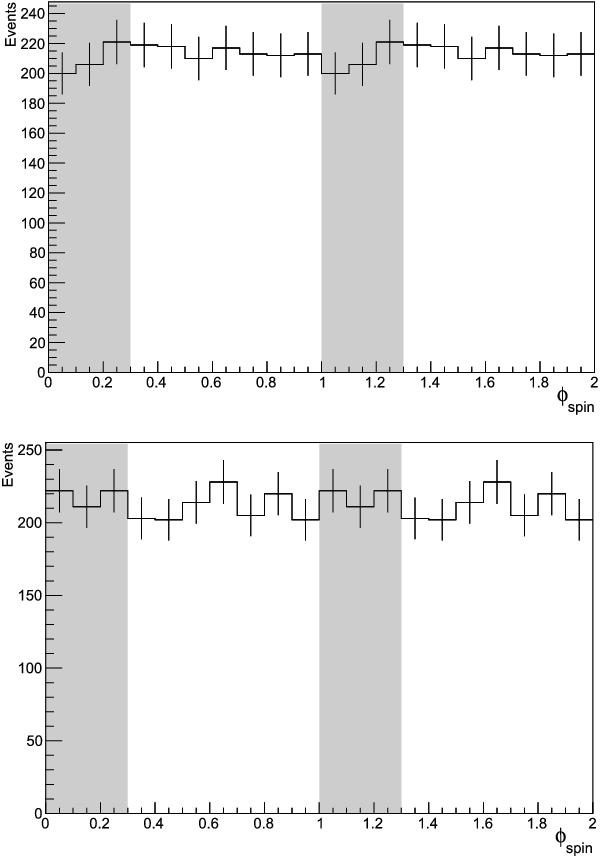
Phaseogram for the MAGIC data above 200 GeV for a frequency of 30.23 mHz (top) and 60.46 mHz (bottom). The shaded area corresponds to the region where the signal is expected assuming a duty cycle of 30%.
This figure is made of several images, please see below:
Current usage metrics show cumulative count of Article Views (full-text article views including HTML views, PDF and ePub downloads, according to the available data) and Abstracts Views on Vision4Press platform.
Data correspond to usage on the plateform after 2015. The current usage metrics is available 48-96 hours after online publication and is updated daily on week days.
Initial download of the metrics may take a while.