Fig. 2
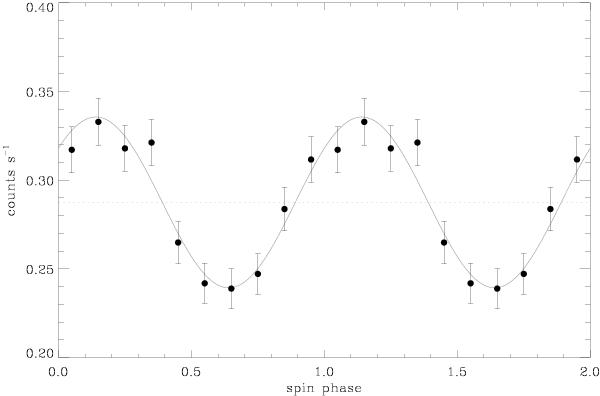
XRT spin-phase-folded light curve in the energy range 0.5−10 keV. Two cycles are shown for clarity. The errors quoted are the square root of number of counts in the source region plus the area-scaled number of counts in the background region, divided by the exposure. The continuous black line shows the best fit with a cosine A(φspin) function. The dashed line represents the mean value A0 = 0.260 counts s-1 obtained from the fit.
Current usage metrics show cumulative count of Article Views (full-text article views including HTML views, PDF and ePub downloads, according to the available data) and Abstracts Views on Vision4Press platform.
Data correspond to usage on the plateform after 2015. The current usage metrics is available 48-96 hours after online publication and is updated daily on week days.
Initial download of the metrics may take a while.