Fig. 1
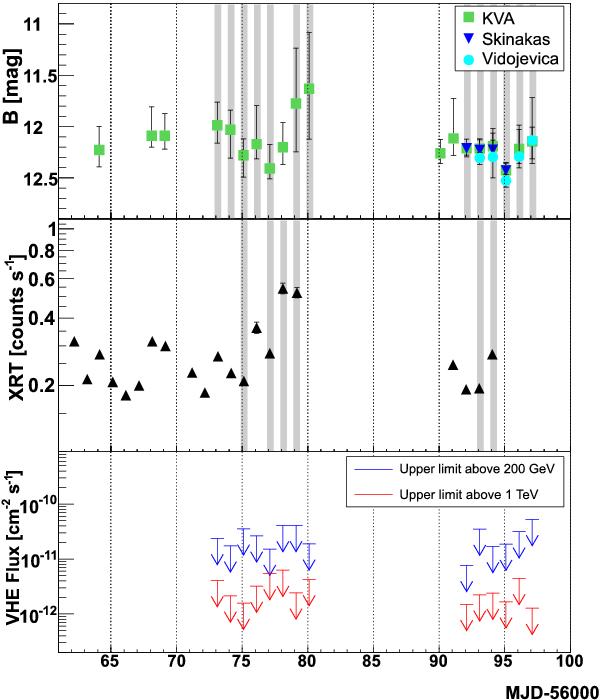
Light curves of the multiwavelength campaign. The plot includes B magnitudes measured by the optical telescopes (top), XRT count rate in the energy range 0.5–10 keV (middle) and MAGIC daily integral U.L. assuming a power-law spectrum with a 2.6 photon spectral index above 200 GeV and 1 TeV (bottom). Vertical dotted lines every 5 days are plotted across all the panels for reference. For the optical data, since the source variability is very large, the point plotted is the average magnitude of the night and the error bars indicate the maximum and minimum magnitude reached during that observation night. The shaded areas indicate the X-ray and optical observations with simultaneous data with MAGIC.
Current usage metrics show cumulative count of Article Views (full-text article views including HTML views, PDF and ePub downloads, according to the available data) and Abstracts Views on Vision4Press platform.
Data correspond to usage on the plateform after 2015. The current usage metrics is available 48-96 hours after online publication and is updated daily on week days.
Initial download of the metrics may take a while.