Fig. 2
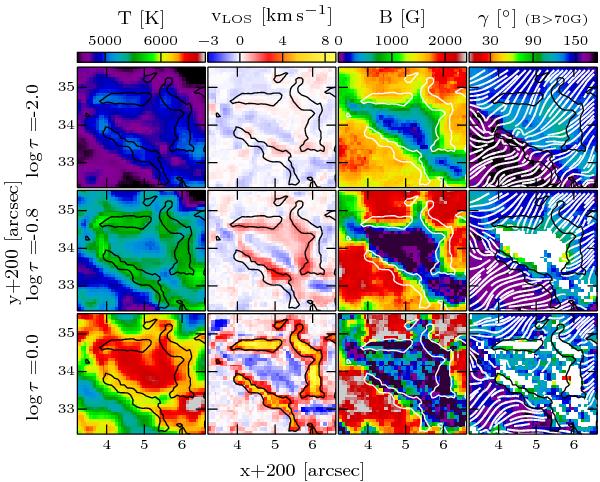
Light bridge granule (LBG, inset (B1) in Fig. 1): plotted are from left to right: temperature T, LOS velocity, magnetic field strength B, and inclination γ (color scale) of the magnetic field to the LOS for the three log τ nodes used in the inversion (from top to bottom). The azimuth is overplotted as white lines on the inclination plots (rightmost panels). Inclination and azimuth lines are only plotted for B > 70 G. The black contour lines enclose regions of LOS velocities greater than +3 km s-1 in the deepest layer.
Current usage metrics show cumulative count of Article Views (full-text article views including HTML views, PDF and ePub downloads, according to the available data) and Abstracts Views on Vision4Press platform.
Data correspond to usage on the plateform after 2015. The current usage metrics is available 48-96 hours after online publication and is updated daily on week days.
Initial download of the metrics may take a while.