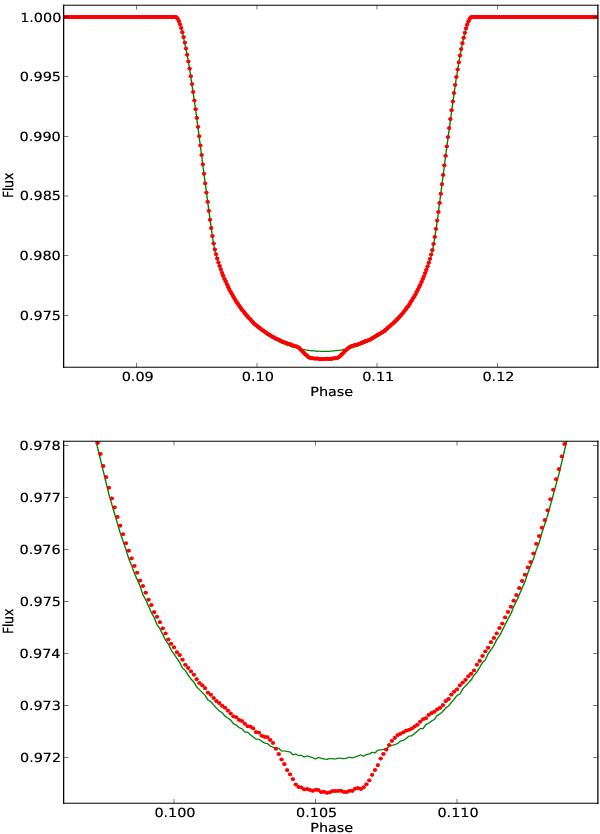
Fig. 2

Top: a sample light curve of our simulations. The system consists of an M star with a 9 day rotational period with a Jupiter-sized planet (Rp/R∗ = 0.15) in a 3 day orbit. We considered a plage with a filling factor of 0.25% on the surface of the star. The red curve corresponds to the case when the transiting planet occults the plage. The green curve shows the best fit transit light curve without considering the occultation. Bottom: zoomed-in at the bottom of light curve.
Current usage metrics show cumulative count of Article Views (full-text article views including HTML views, PDF and ePub downloads, according to the available data) and Abstracts Views on Vision4Press platform.
Data correspond to usage on the plateform after 2015. The current usage metrics is available 48-96 hours after online publication and is updated daily on week days.
Initial download of the metrics may take a while.


