Fig. A.1
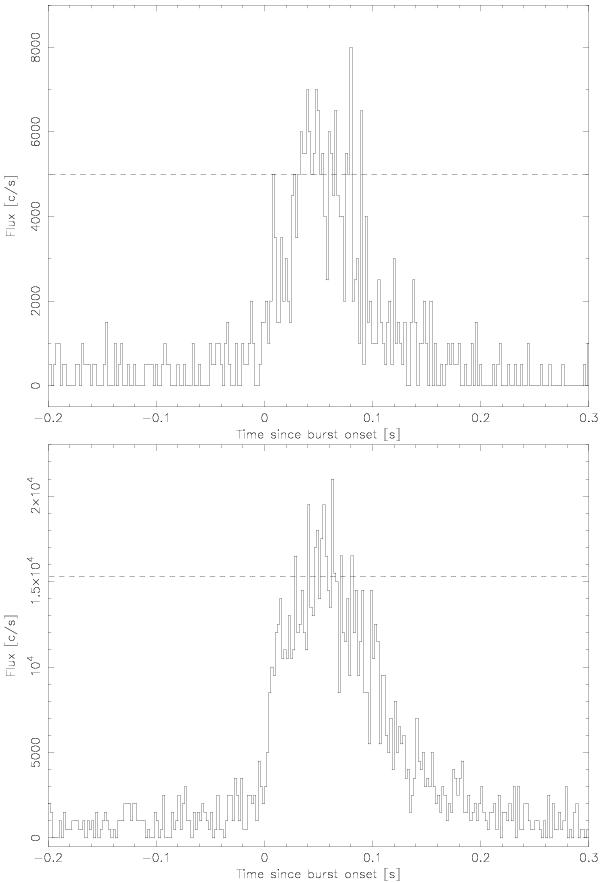
Full bandpass light curves of two bursts detected from 4U 1820-30 on MJD 54 958.740 (top; one active PCU) and MJD 54 981.187 (bottom; three active PCUs). The horizontal dashed lines indicate the Eddington limit in c s-1 as measured through the peak flux during the main burst phase later on. The time resolution of both light curves is 2 ms.
Current usage metrics show cumulative count of Article Views (full-text article views including HTML views, PDF and ePub downloads, according to the available data) and Abstracts Views on Vision4Press platform.
Data correspond to usage on the plateform after 2015. The current usage metrics is available 48-96 hours after online publication and is updated daily on week days.
Initial download of the metrics may take a while.