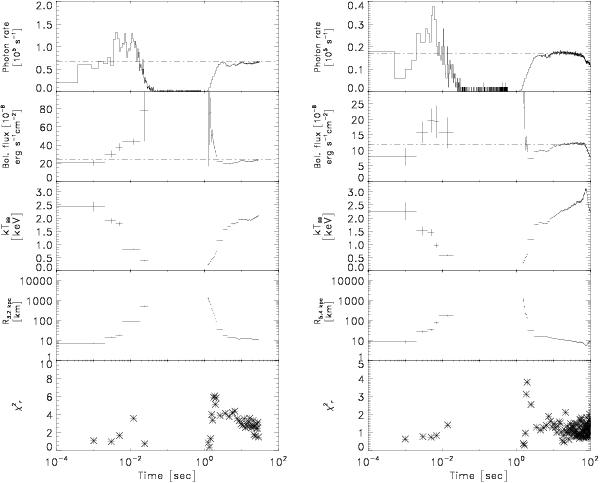
Fig. 3

Time-resolved spectroscopy of 4U 0614+09 (left) and 2S 0918-549 (right). The dash-dotted lines indicate maximum flux levels measured as late as possible in the burst. The spectral model is a simple Planck function. The count rate (top panel) is not corrected for dead time while the bolometric flux and radius are. We note that the Cash statistic was employed for finding the best fit, not the  parameter shown in the bottom panels.
Current usage metrics show cumulative count of Article Views (full-text article views including HTML views, PDF and ePub downloads, according to the available data) and Abstracts Views on Vision4Press platform.
Data correspond to usage on the plateform after 2015. The current usage metrics is available 48-96 hours after online publication and is updated daily on week days.
Initial download of the metrics may take a while.


