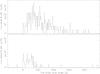
Fig. 2
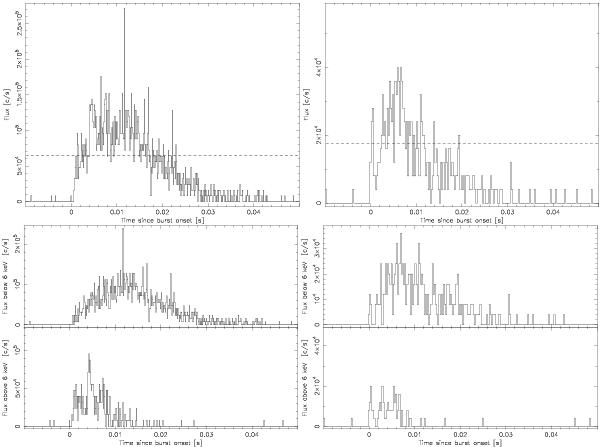
X-ray light curves of the precursor to the burst from 4U 0614+09 at 122 μs time resolution (left panels) and the burst from 2S 0918-549 at 0.25 ms resolution (right panels). The top graphs refers to photons at all photon energies, the middle ones to photons of energies below 6 keV, and the bottom ones to those above 6 keV. The X-axis refers to time since burst onset in sec. The horizontal dashed lines indicate the level of the flux at which the Eddington limit is reached in the main burst.
Current usage metrics show cumulative count of Article Views (full-text article views including HTML views, PDF and ePub downloads, according to the available data) and Abstracts Views on Vision4Press platform.
Data correspond to usage on the plateform after 2015. The current usage metrics is available 48-96 hours after online publication and is updated daily on week days.
Initial download of the metrics may take a while.