Fig. 2
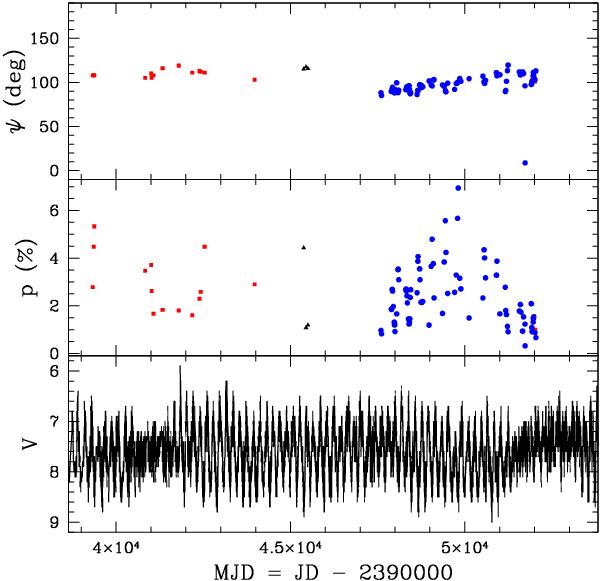
Measured position angle, ψ, in degrees; polarization; and visual brightness for V CVn from the AAVSO database, where the red squares are data from Poliakova (1981), black triangles are from Magalhães et al. (1986b) and the blue circles represent the HPOL data. Differences between this plot and Fig. 1 are because of the additional time span from MJD = 3.9 × 10⁴ − 4.4 × 10⁴ considered. The corresponding V-band light curve is included for comparison.
Current usage metrics show cumulative count of Article Views (full-text article views including HTML views, PDF and ePub downloads, according to the available data) and Abstracts Views on Vision4Press platform.
Data correspond to usage on the plateform after 2015. The current usage metrics is available 48-96 hours after online publication and is updated daily on week days.
Initial download of the metrics may take a while.