Free Access
Fig. 7
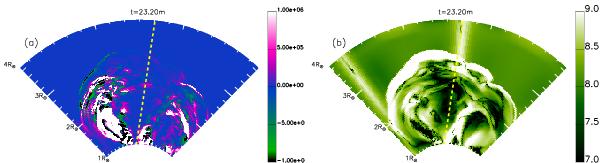
a) Map of temperature differences between the simulation where the non-ideal terms are considered and the simulation without them in the (r − φ) plane passing through the centre of the bipoles at t = 23.20 min. b) Map of Log10 of | ∇T∥ B |, the gradient along the magnetic field on the same plane and at the same time.
This figure is made of several images, please see below:


Current usage metrics show cumulative count of Article Views (full-text article views including HTML views, PDF and ePub downloads, according to the available data) and Abstracts Views on Vision4Press platform.
Data correspond to usage on the plateform after 2015. The current usage metrics is available 48-96 hours after online publication and is updated daily on week days.
Initial download of the metrics may take a while.