Fig. 4
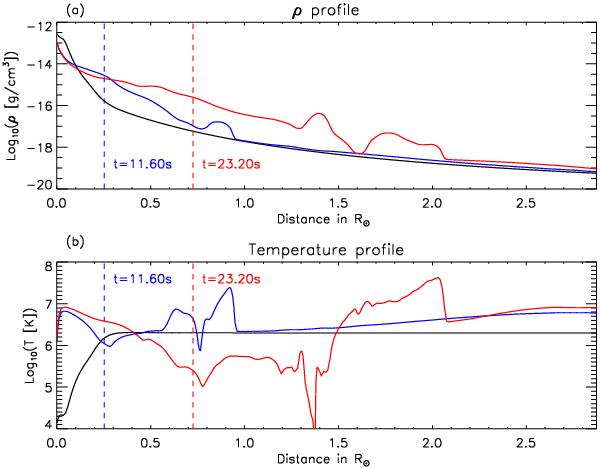
a) Profiles of Log10(ρ). b) Profiles of Log10(T). All the profiles are along the yellow dashed line in Fig. 3d which represents the direction of the flux rope ejection at t = 0 min (black line), t = 11.60 min (blue line), and t = 23.20 min (red line). The dashed lines mark the position of the centre of the flux rope at each time.
Current usage metrics show cumulative count of Article Views (full-text article views including HTML views, PDF and ePub downloads, according to the available data) and Abstracts Views on Vision4Press platform.
Data correspond to usage on the plateform after 2015. The current usage metrics is available 48-96 hours after online publication and is updated daily on week days.
Initial download of the metrics may take a while.