Fig. 2
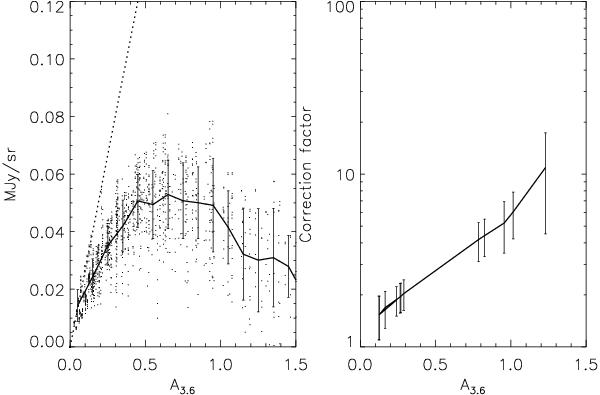
Left: surface brightness at 3.6 μm as a function of extinction for the model cores. The solid line is the average surface brightness. The dashed line is from a linear interpolation of the very optically thin case. Right: the correction factor for the adopted sample based on the ratio of the extrapolated and model surface brightness from the left.
Current usage metrics show cumulative count of Article Views (full-text article views including HTML views, PDF and ePub downloads, according to the available data) and Abstracts Views on Vision4Press platform.
Data correspond to usage on the plateform after 2015. The current usage metrics is available 48-96 hours after online publication and is updated daily on week days.
Initial download of the metrics may take a while.