Fig. 7
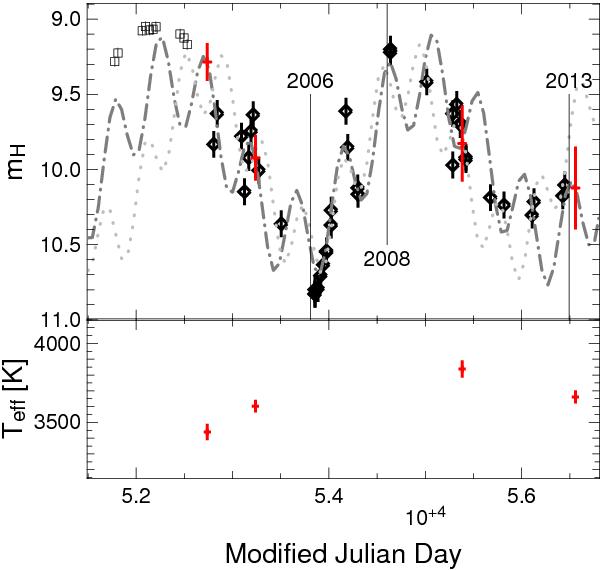
Top: H-band light curve after year 2000. Bottom: effective temperature measurements from SINFONI spectra. Diamonds: NACO data (fitted); squares: Peeples et al. (2007, for comparison). Dash-dotted, dark grey curve: best-fit two-period model. Dotted, light grey curve: second best-fit model. Vertical lines: dates of interferometric observations: March 2006 (Pott et al. 2008, K-band AMBER), May 2008 (K-band AMBER) and July 2013 (H-band PIONIER). Crosses: Teff from SINFONI spectra and the corresponding magnitude estimated using the best fit model; the vertical line of each cross indicates only the statistical uncertainty (see text, Sect. 3.3).
Current usage metrics show cumulative count of Article Views (full-text article views including HTML views, PDF and ePub downloads, according to the available data) and Abstracts Views on Vision4Press platform.
Data correspond to usage on the plateform after 2015. The current usage metrics is available 48-96 hours after online publication and is updated daily on week days.
Initial download of the metrics may take a while.