Fig. 5
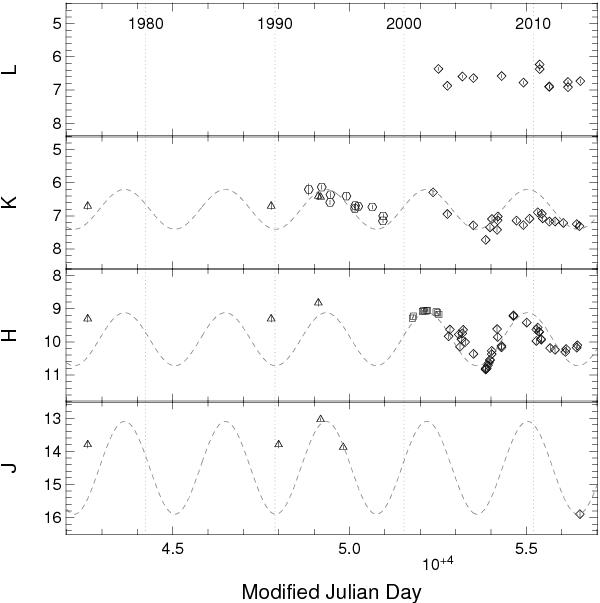
J,H,Ks, and L-band light curves. The oldest data is from 1975, the latest from June 2013. Statistical uncertainties are represented, although they are often smaller than the symbol. Diamonds: NACO data; squares: from Peeples et al. (2007); circles: from Ott et al. (1999, these points have been brought up by 0.3 mag); triangles: from Blum et al. (1996a) which includes data from Becklin & Neugebauer (1975) and Depoy & Sharp (1991). Dashed curves: sinusoidal models with a period of 2850 d.
Current usage metrics show cumulative count of Article Views (full-text article views including HTML views, PDF and ePub downloads, according to the available data) and Abstracts Views on Vision4Press platform.
Data correspond to usage on the plateform after 2015. The current usage metrics is available 48-96 hours after online publication and is updated daily on week days.
Initial download of the metrics may take a while.