Fig. 11
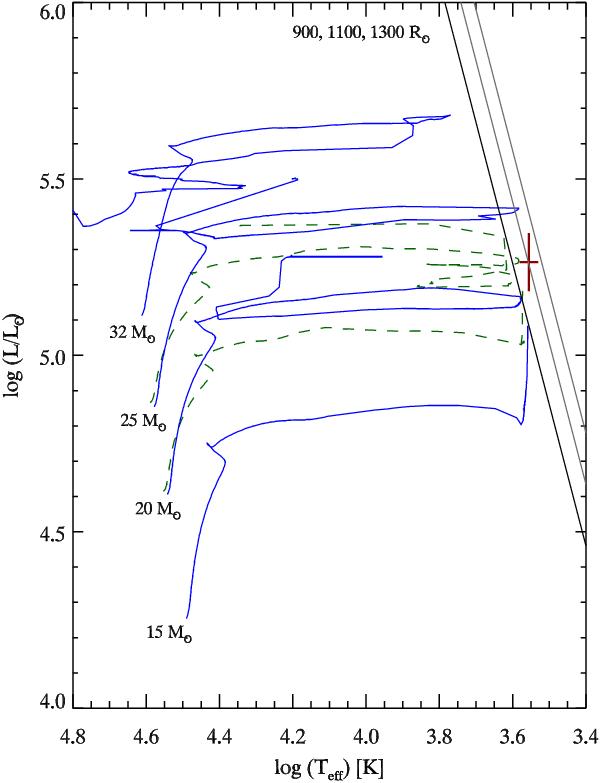
Position of GCIRS 7 in the H-R diagram (cross) compared with evolutionary tracks of stars with initial masses between Mini = 15 − 32 M⊙ with rotation (blue solid) and for Mini = 20 − 25 M⊙ without rotation (dashed green) from Ekström et al. (2012). The solid black lines denote the theoretical luminosities of stars with radii of R = 900,1100, and 1300 R⊙ as a function of effective temperature.
Current usage metrics show cumulative count of Article Views (full-text article views including HTML views, PDF and ePub downloads, according to the available data) and Abstracts Views on Vision4Press platform.
Data correspond to usage on the plateform after 2015. The current usage metrics is available 48-96 hours after online publication and is updated daily on week days.
Initial download of the metrics may take a while.