Fig. 2
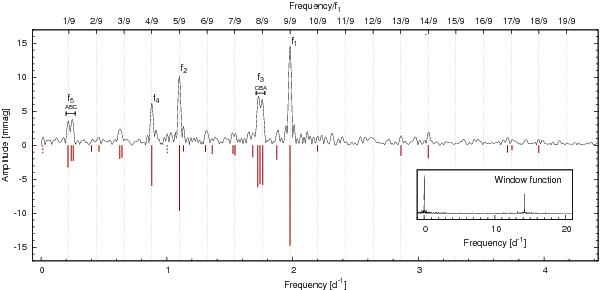
Fourier amplitude spectrum of the MOST light curve of HR 8799. The actual spectrum is shown in the positive amplitude range, while the 28-frequency solution, listed in Table 1, is represented by thick vertical lines in the negative amplitude range. Instrumental frequency components are marked by dotted lines. The most prominent frequencies and frequency groups are labelled. The n/9 f1 frequency grid is indicated by dashed gray lines. The insert shows the window function of the data. The only high-amplitude alias is at the orbital frequency of the satellite, which causes aliasing only far out of the investigated range.
Current usage metrics show cumulative count of Article Views (full-text article views including HTML views, PDF and ePub downloads, according to the available data) and Abstracts Views on Vision4Press platform.
Data correspond to usage on the plateform after 2015. The current usage metrics is available 48-96 hours after online publication and is updated daily on week days.
Initial download of the metrics may take a while.