Free Access
Fig. 4
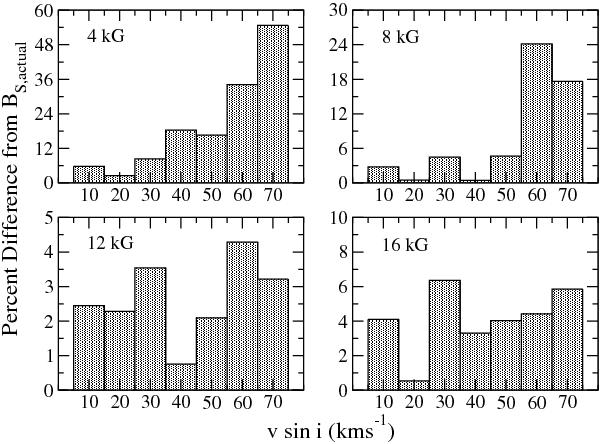
Percent differences between the measured ⟨ B ⟩ values from Eq. (3) to the actual ⟨ B ⟩ value from the synthetic spectra (as reported by ZEEMAN) plotted against vsini. The approximate field strength is shown in each panel. Note that the y-axis is different for each panel.
Current usage metrics show cumulative count of Article Views (full-text article views including HTML views, PDF and ePub downloads, according to the available data) and Abstracts Views on Vision4Press platform.
Data correspond to usage on the plateform after 2015. The current usage metrics is available 48-96 hours after online publication and is updated daily on week days.
Initial download of the metrics may take a while.