Fig. 1
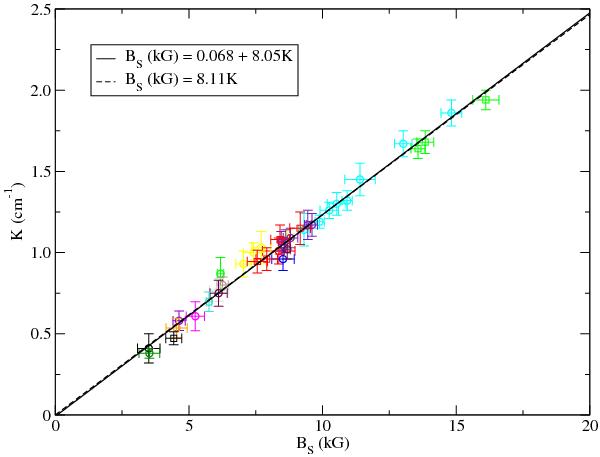
Measured K-parameters versus the surface field strengths (as measured from observed splitting in Fe II 6149) from the values in Table 3. Each colour and/or shape indicates measurements from an individual star. The solid line is the best-fit line of all the data and the dotted black line is the best-fit when forcing the y-intercept through the origin.
Current usage metrics show cumulative count of Article Views (full-text article views including HTML views, PDF and ePub downloads, according to the available data) and Abstracts Views on Vision4Press platform.
Data correspond to usage on the plateform after 2015. The current usage metrics is available 48-96 hours after online publication and is updated daily on week days.
Initial download of the metrics may take a while.