Fig. 6
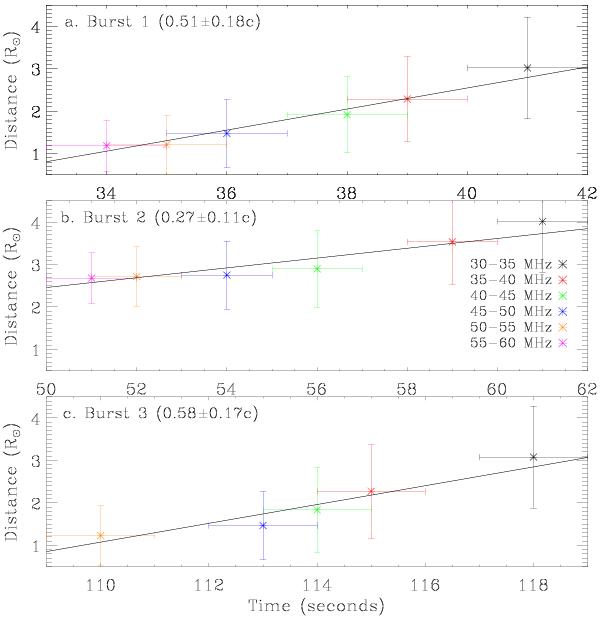
Radial motion of Bursts 1, 2 and 3. The velocities given on the left of each panel were calculated from the slope of the fit. The colours correspond to different frequency bins from 30 to 60 MHz. The error bars in the three plots are calculated based on the FWHM of the beams at each frequency.
Current usage metrics show cumulative count of Article Views (full-text article views including HTML views, PDF and ePub downloads, according to the available data) and Abstracts Views on Vision4Press platform.
Data correspond to usage on the plateform after 2015. The current usage metrics is available 48-96 hours after online publication and is updated daily on week days.
Initial download of the metrics may take a while.