Fig. 3
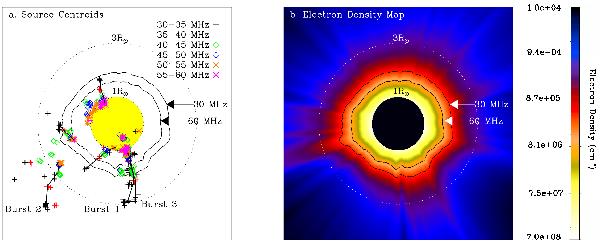
a) Centroids of Type III radio burst emission sources observed during a 30 min period at frequencies between 30 and 60 MHz sampled in 5 MHz–wide frequency bins. The solid lines represent the motion of some of the Type III radio bursts within each individual group. b) Electron density map of the solar corona (Zucca et al. 2014). The solid contours are plotted for the 30 MHz and 60 MHz emission sites assuming harmonic plasma emission in this density map.
Current usage metrics show cumulative count of Article Views (full-text article views including HTML views, PDF and ePub downloads, according to the available data) and Abstracts Views on Vision4Press platform.
Data correspond to usage on the plateform after 2015. The current usage metrics is available 48-96 hours after online publication and is updated daily on week days.
Initial download of the metrics may take a while.