Fig. 1
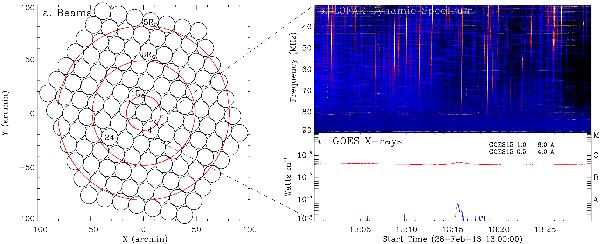
a) Map of a LOFAR 126-beam tied-array pointing at the Sun. The center beam is pointing at the Sun center with successive beams around it in a honeycomb pattern to cover the station field-of-view (FOV) of ~3.3°. The circles represent the beam size at a frequency of 45 MHz. The separation between beam centers is ~ 14′. b) 30 min dynamic spectrum recorded by one of the LOFAR tied-array beams (Beam 4) indicated in panel a), on 2013 February 28. There are multiple Type III radio bursts in this observation. c) X-ray lightcurve measured by the GOES satellite during the time of the observation for two channels. The labels A, B, C and M represent solar flare classes based on the solar X-ray flux, with A being the smallest class of flares.
Current usage metrics show cumulative count of Article Views (full-text article views including HTML views, PDF and ePub downloads, according to the available data) and Abstracts Views on Vision4Press platform.
Data correspond to usage on the plateform after 2015. The current usage metrics is available 48-96 hours after online publication and is updated daily on week days.
Initial download of the metrics may take a while.