Fig. A.1
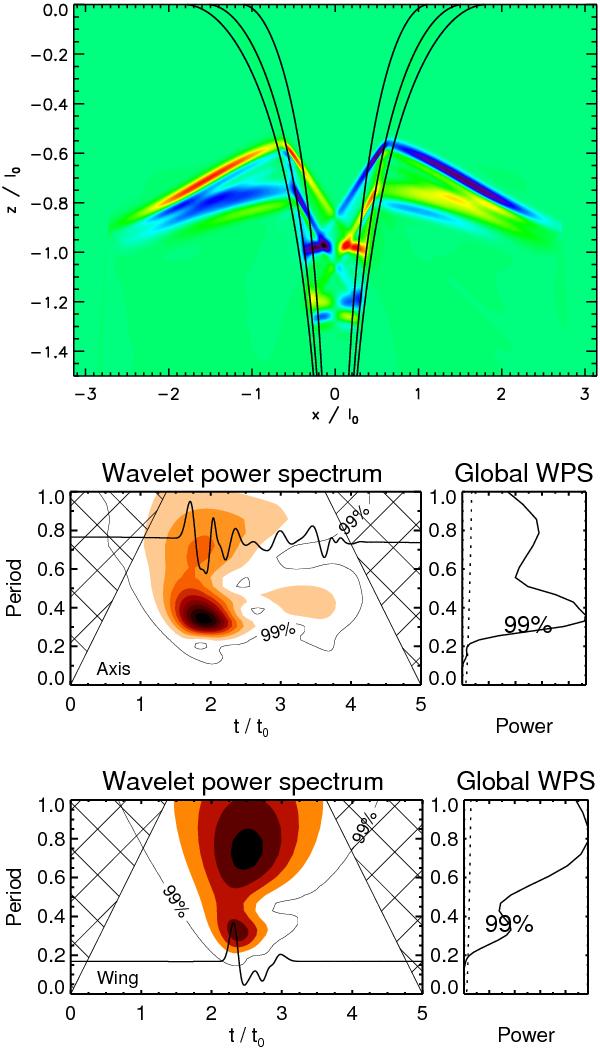
Snapshot of density perturbations (top) at
 for a dense funnel with
ρF/ρ∞
= 3 and p = 8 and a kink mode perturbation. The line
contours outline the equilibrium density profile. The middle and bottom
panels show the wavelet analysis for the density perturbations measured
near the axis and in the wing, respectively.
for a dense funnel with
ρF/ρ∞
= 3 and p = 8 and a kink mode perturbation. The line
contours outline the equilibrium density profile. The middle and bottom
panels show the wavelet analysis for the density perturbations measured
near the axis and in the wing, respectively.
Current usage metrics show cumulative count of Article Views (full-text article views including HTML views, PDF and ePub downloads, according to the available data) and Abstracts Views on Vision4Press platform.
Data correspond to usage on the plateform after 2015. The current usage metrics is available 48-96 hours after online publication and is updated daily on week days.
Initial download of the metrics may take a while.