Fig. 9
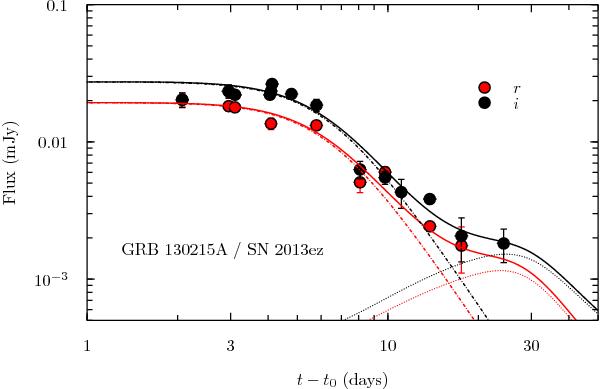
GRB 130215A/SN 2013ez: optical LCs in r (red) and i (black). The AG (dot-dashed) and SN (dotted) components are shown in the same colour as their corresponding filter, while the solid lines are the sum of both components. Data at times >+2 d have been fitted with a broken PL consisting of a plateau phase and a break to a steeper decay phase. We assume that the time at which the LC breaks and the decay rate after the break are the same in both filters. The best-fitting values (for magnitudes that are not host-subtracted, see the main text) are α2 = 3.28 ± 0.25 and TB = 6.39 ± 0.35 d. Due to the (1) lack of host detection in our deep GTC images, and (2) lack of datapoints at times when the SN is the dominant source of flux we have not been able to precisely constrain the SN’s properties. When we considered the two extremes of the host brightness (see main text), we constrained the luminosity factor of SN 2013ez to be 0.6 ≤ k ≤ 0.75.
Current usage metrics show cumulative count of Article Views (full-text article views including HTML views, PDF and ePub downloads, according to the available data) and Abstracts Views on Vision4Press platform.
Data correspond to usage on the plateform after 2015. The current usage metrics is available 48-96 hours after online publication and is updated daily on week days.
Initial download of the metrics may take a while.