Fig. 7
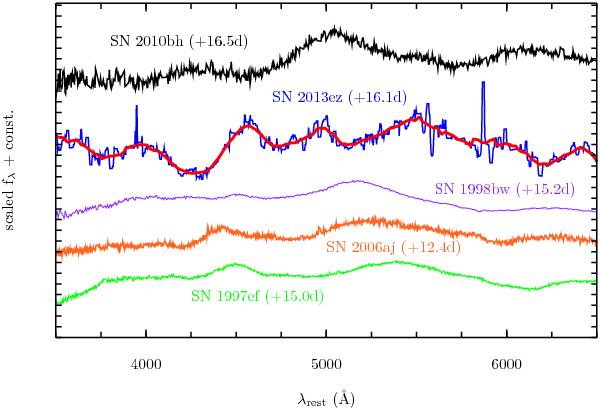
GRB 130215A/SN 2013ez: for comparison, we plot the spectra of several GRB-SNe (SN 1998bw, purple line; SN 2006aj, orange line; SN 2010bh, black line) and one SN Ic-BL (SN 1997ef, green line) that was not associated with a GRB, each at a similar post-explosion date as SN 2013ez. All times are rest-frame and the spectra have been scaled and shifted for clarity. It is seen that the absorption features in the spectrum of 2013ez are not as broad as those of the comparison SNe.
Current usage metrics show cumulative count of Article Views (full-text article views including HTML views, PDF and ePub downloads, according to the available data) and Abstracts Views on Vision4Press platform.
Data correspond to usage on the plateform after 2015. The current usage metrics is available 48-96 hours after online publication and is updated daily on week days.
Initial download of the metrics may take a while.