Fig. A.1
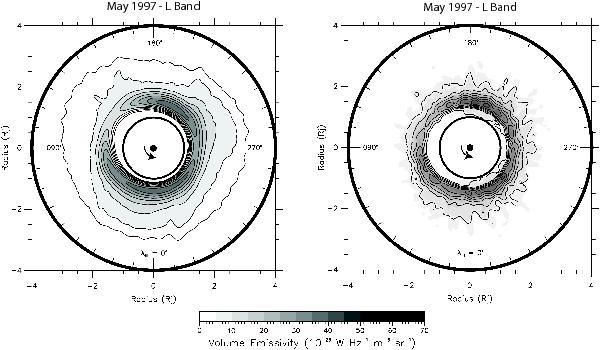
Tomographic images of the equatorial brightness distribution of Jupiter’s synchrotron emission in L band reconstructed for the VLA observations of May 1997. Left: using a single value decomposition approach (Santos-Costa et al. 2011b). Right: using a three-dimensional Fourier approach (Sault et al. 1997b). The north magnetic pole is indicated by the dark dot and the planet rotation with the arrow. The coordinate system is the SIII longitude. Despite some differences in the distributions (see also Fig. 6 for further comparisons), the two tomographic reconstruction techniques return compatible results, i.e., distributions projected onto the magnetic equator, and both techniques show that the equatorial radiation is primarily confined around the planet at radial distances of ~1.3−1.8 RJ.
Current usage metrics show cumulative count of Article Views (full-text article views including HTML views, PDF and ePub downloads, according to the available data) and Abstracts Views on Vision4Press platform.
Data correspond to usage on the plateform after 2015. The current usage metrics is available 48-96 hours after online publication and is updated daily on week days.
Initial download of the metrics may take a while.