Fig. 6
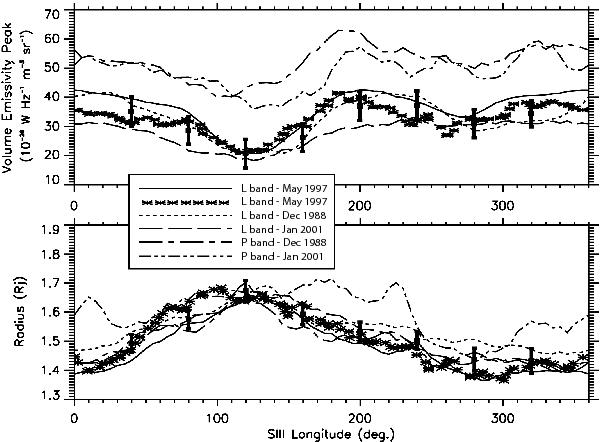
Longitudinal comparisons of the brightness peak intensity (top panel) and radial position (bottom panel) of the volume emissivity maximum between radio bands and epochs. Profiles are derived from cartography of equatorial brightness distribution using either a Single Value Decomposition approach (lines) or a three-dimensional Fourier technique (star symbols) (from Figs. 5 and A.1). Error bars were calculated for the L-band observations and represent one standard deviation. They are placed as they would follow the mean longitudinal profiles, which are not plotted for clarity reasons.
Current usage metrics show cumulative count of Article Views (full-text article views including HTML views, PDF and ePub downloads, according to the available data) and Abstracts Views on Vision4Press platform.
Data correspond to usage on the plateform after 2015. The current usage metrics is available 48-96 hours after online publication and is updated daily on week days.
Initial download of the metrics may take a while.