Fig. 3
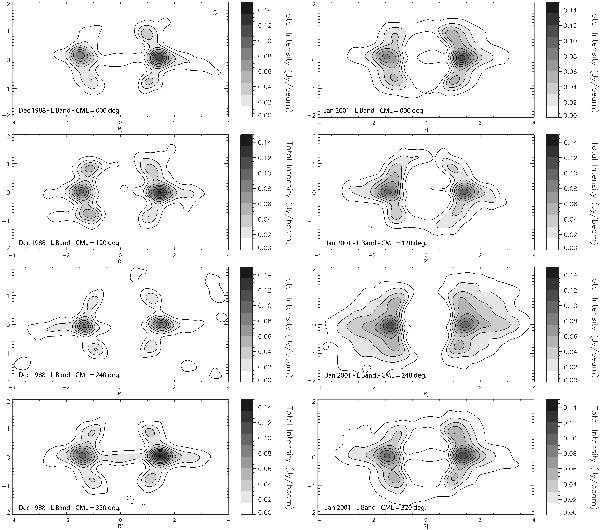
Radio maps in total intensity of Jupiter’s synchrotron radiation at the wavelength of L band and CMLs of 0, 120, 240, and 320 degrees. For a radio map at a given CML, data at ±40° of that CML were used. All radio maps were degraded to the same image resolution. Differences between brightness distributions at the same CMLs are observed.
Current usage metrics show cumulative count of Article Views (full-text article views including HTML views, PDF and ePub downloads, according to the available data) and Abstracts Views on Vision4Press platform.
Data correspond to usage on the plateform after 2015. The current usage metrics is available 48-96 hours after online publication and is updated daily on week days.
Initial download of the metrics may take a while.