Fig. 4
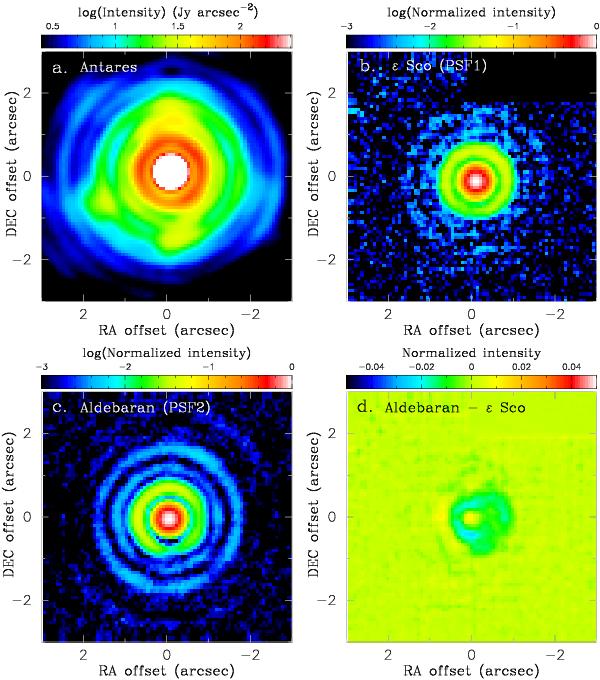
Enlarged view of the inner 3′′× 3′′ region of the flux-calibrated Antares image, together with the PSF references ε Sco and Aldebaran. North is up, and east to the left. a) Flux-calibrated image of Antares. The colors are shown on a logarithmic scale, but the colors in the central region are saturated. b) Image of the PSF reference ε Sco. The intensity is normalized with the peak intensity. The colors are shown on a logarithmic scale. c) Image of the PSF reference Aldebaran, shown in the same manner as in b). d) Difference between the images of ε Sco and Aldebaran. The colors are shown on a linear scale, ranging from − 5% to 5% of the peak intensity of the PSF reference images.
Current usage metrics show cumulative count of Article Views (full-text article views including HTML views, PDF and ePub downloads, according to the available data) and Abstracts Views on Vision4Press platform.
Data correspond to usage on the plateform after 2015. The current usage metrics is available 48-96 hours after online publication and is updated daily on week days.
Initial download of the metrics may take a while.