Fig. 5
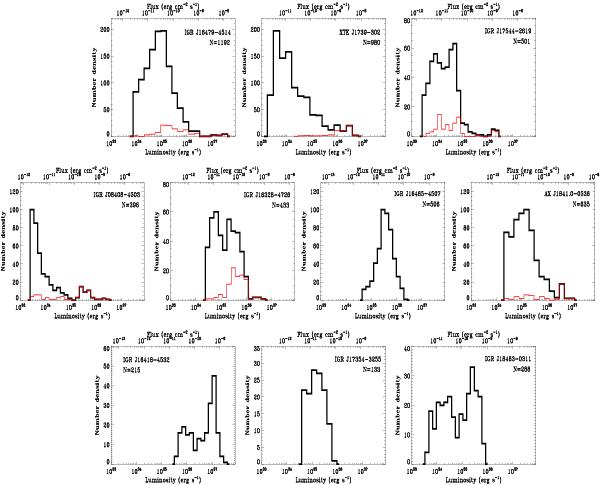
Distributions of the XRT 2−10 keV luminosity (lower axis) and flux (unabsorbed, upper axis) drawn from the light curves binned at 100 s. Top: SFXTs monitored for two years (Romano et al. 2011); the thin red histograms show the part of the data collected as outburst observations, thus including both the initial bright flare and the follow-up observations. Middle: SFXTs monitored for one year (J1841 in Romano et al. 2009); the thin red histograms show outburst observations collected outside of the monitoring campaign (one outburst per source). Bottom: SFXTs monitored for one orbital period (Romano et al. 2010; Ducci et al. 2013; Romano et al. 2012b). The sample size, N, is reported in each panel.
Current usage metrics show cumulative count of Article Views (full-text article views including HTML views, PDF and ePub downloads, according to the available data) and Abstracts Views on Vision4Press platform.
Data correspond to usage on the plateform after 2015. The current usage metrics is available 48-96 hours after online publication and is updated daily on week days.
Initial download of the metrics may take a while.