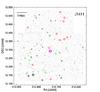
Fig. 3
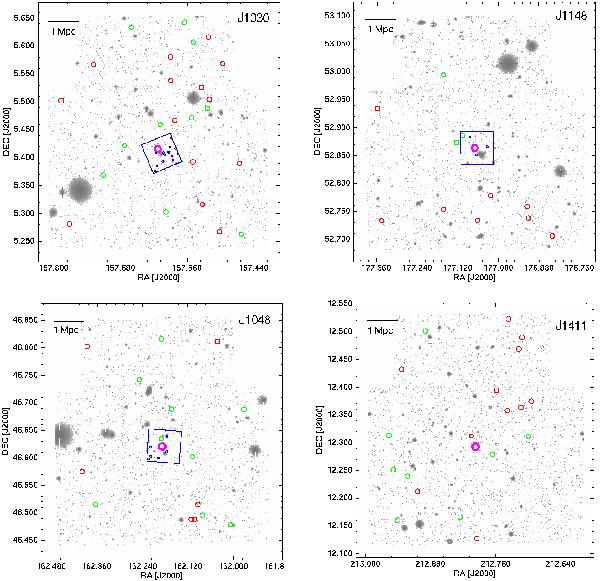
Spatial distribution of z ~ 6 galaxy candidates around the four QSOs (magenta thick circles) overlaid on the LBC z-band images. Red and green circles indicate our primary and secondary candidates. The small blue dots mark the faint i-band dropouts (25 < z850 < 26.5) found in the previous study of K09 carried out with HST/ACS observations. The 3 × 3 arcmin2 ACS FoV is shown by the blue squares.
Current usage metrics show cumulative count of Article Views (full-text article views including HTML views, PDF and ePub downloads, according to the available data) and Abstracts Views on Vision4Press platform.
Data correspond to usage on the plateform after 2015. The current usage metrics is available 48-96 hours after online publication and is updated daily on week days.
Initial download of the metrics may take a while.