Fig. 9
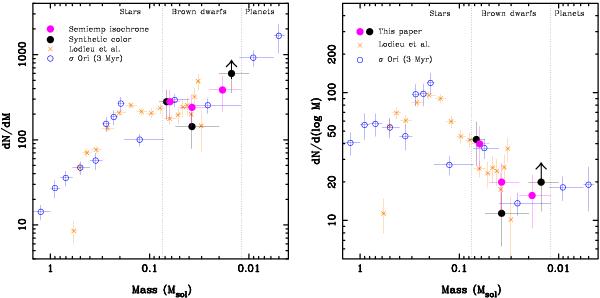
Pleiades mass spectrum (left) and mass function (right) obtained by combining our data (black and magenta filled circles) with data from Lodieu et al. (2012, brown crosses). Also included is the mass spectrum and mass function of the σ Orionis cluster (~3 Myr) from Peña Ramírez et al. (2012, blue open circles). All functions are normalized to the total number of brown dwarfs in the mass interval 0.075−0.03 M⊙ found in our survey. The agreement between the two clusters is remarkable. Vertical dotted lines stand for the hydrogen and deuterium-burning mass limits at ≈0.072 and ≈0.012 M⊙. Vertical error bars indicate Poisson uncertainties, and horizontal error bars correspond to mass intervals. The incomplete mass bin is marked with an upper arrow. Both axes are in logarithmic scale.
Current usage metrics show cumulative count of Article Views (full-text article views including HTML views, PDF and ePub downloads, according to the available data) and Abstracts Views on Vision4Press platform.
Data correspond to usage on the plateform after 2015. The current usage metrics is available 48-96 hours after online publication and is updated daily on week days.
Initial download of the metrics may take a while.