Fig. 8
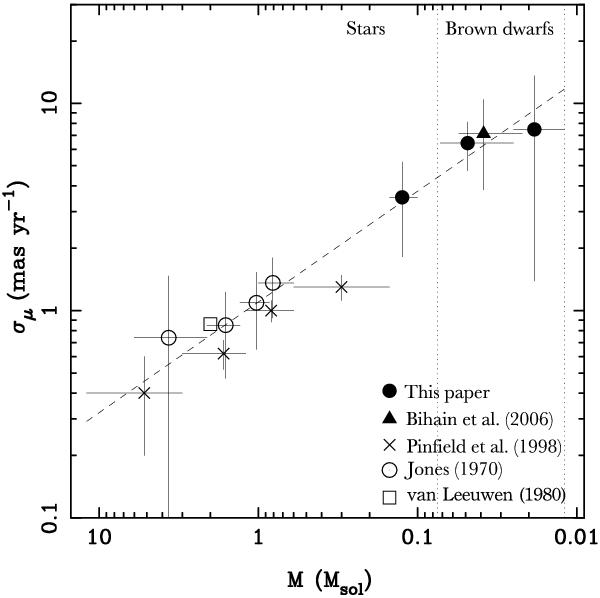
Pleiades proper motion dispersion plotted against mass. Data from various studies (including our own) covering from 12 to 0.012 M⊙ are depicted with different symbols (see the legend within the diagram). Vertical error bars stand for the uncertainties in the motion-dispersion determination, and horizontal error bars account for mass intervals. The dashed line corresponds to the best fit to all data points excluding the least massive datum from Pinfield et al. (1998). The slope of the fit is −0.53, suggesting near-equipartition of energy for stars and brown dwarfs in the cluster. Vertical dotted lines separate the stellar and the brown dwarf domains.
Current usage metrics show cumulative count of Article Views (full-text article views including HTML views, PDF and ePub downloads, according to the available data) and Abstracts Views on Vision4Press platform.
Data correspond to usage on the plateform after 2015. The current usage metrics is available 48-96 hours after online publication and is updated daily on week days.
Initial download of the metrics may take a while.