Fig. 4
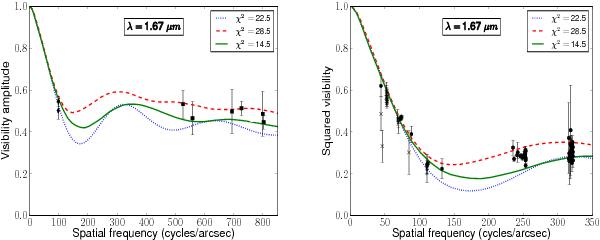
H band interferometric data. The left and right panels show the H band visibility amplitudes and squared visibilities observed by the various instruments. The visibility amplitudes, as produced by the data reduction software packages of the CLIMB and CLASSIC instruments, are not squared in order to preserve the original error statistics. The data are the same as in Paper I. The same three models are shown as in Figs. 1 and 3 and as listed in Table 1.
Current usage metrics show cumulative count of Article Views (full-text article views including HTML views, PDF and ePub downloads, according to the available data) and Abstracts Views on Vision4Press platform.
Data correspond to usage on the plateform after 2015. The current usage metrics is available 48-96 hours after online publication and is updated daily on week days.
Initial download of the metrics may take a while.