Fig. 3
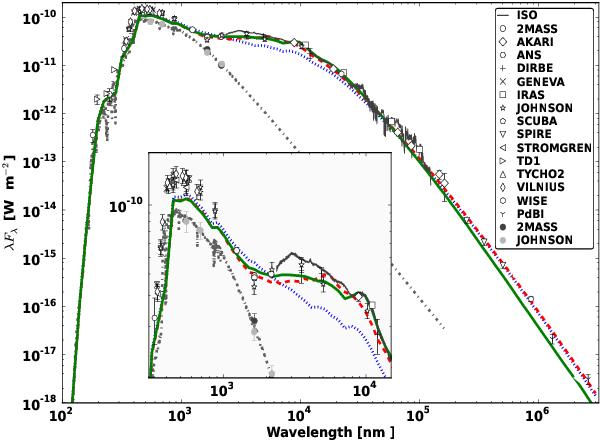
Spectral energy distribution of 89 Her with the same three models as in Figs. 1 and 2 overplotted. The dot-dashed gray line shows the input Kurucz model, here reddened with an interstellar contribution of E(B − V) = 0.07 (see Paper I). The black and gray data points are the “stellar” V,R,H, and K band fluxes as determined in Paper I. Open symbols represent actual measured fluxes in the passbands that are listed in the legend. The full black line is the ISO spectrum. The dotted blue line, “Best 1” in Table 1, clearly does not agree with the observed SED. A better, but still not excellent, fit to the SED can be obtained with an inner radius twice as large, in combination with p = 1.5, but this results in first-lobe near-IR visibilities that are too small (see the text). The dashed red and full green line correspond to the best-fitting double power-law models with metallic Fe and amorphous C opacity sources, respectively (see Fig. 1). The MCMax models have been reddened similarly as the Kurucz model.
Current usage metrics show cumulative count of Article Views (full-text article views including HTML views, PDF and ePub downloads, according to the available data) and Abstracts Views on Vision4Press platform.
Data correspond to usage on the plateform after 2015. The current usage metrics is available 48-96 hours after online publication and is updated daily on week days.
Initial download of the metrics may take a while.