Free Access
Fig. 2
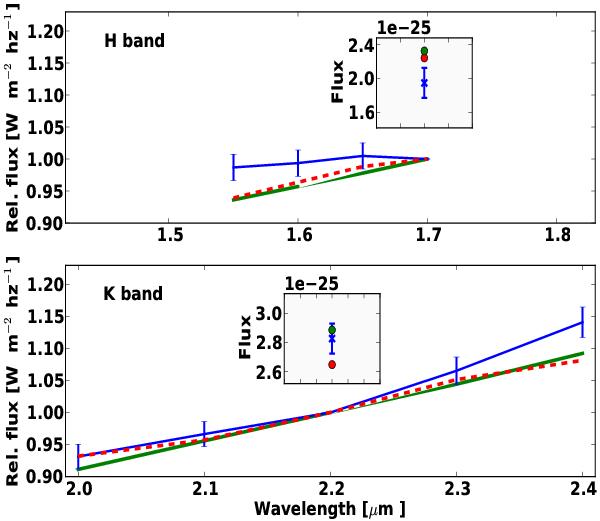
PTI absolute fluxes (in the insets) and spectral shapes over the H (upper panel) and K (lower panel) bands. The data are shown in blue. The dashed red and full green lines correspond to the same models as in Fig. 1.
Current usage metrics show cumulative count of Article Views (full-text article views including HTML views, PDF and ePub downloads, according to the available data) and Abstracts Views on Vision4Press platform.
Data correspond to usage on the plateform after 2015. The current usage metrics is available 48-96 hours after online publication and is updated daily on week days.
Initial download of the metrics may take a while.