Fig. 10
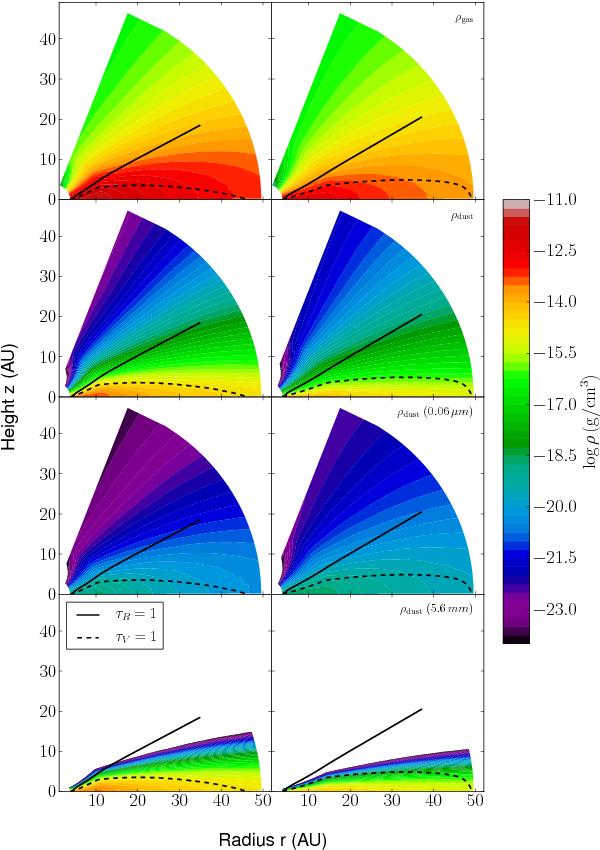
Density structure of our best-fit models. From top to bottom, maps of the gas density, the dust density, the dust density for particles of ~0.06 μm, and the dust density for particles of ~5 mm are shown. On all panels the radial and vertical τ = 1 surfaces at 0.55 μm are overlaid as well, with solid and dashed lines, respectively. The left and right panels contain the best Fe and amorphous C containing models, respectively.
Current usage metrics show cumulative count of Article Views (full-text article views including HTML views, PDF and ePub downloads, according to the available data) and Abstracts Views on Vision4Press platform.
Data correspond to usage on the plateform after 2015. The current usage metrics is available 48-96 hours after online publication and is updated daily on week days.
Initial download of the metrics may take a while.